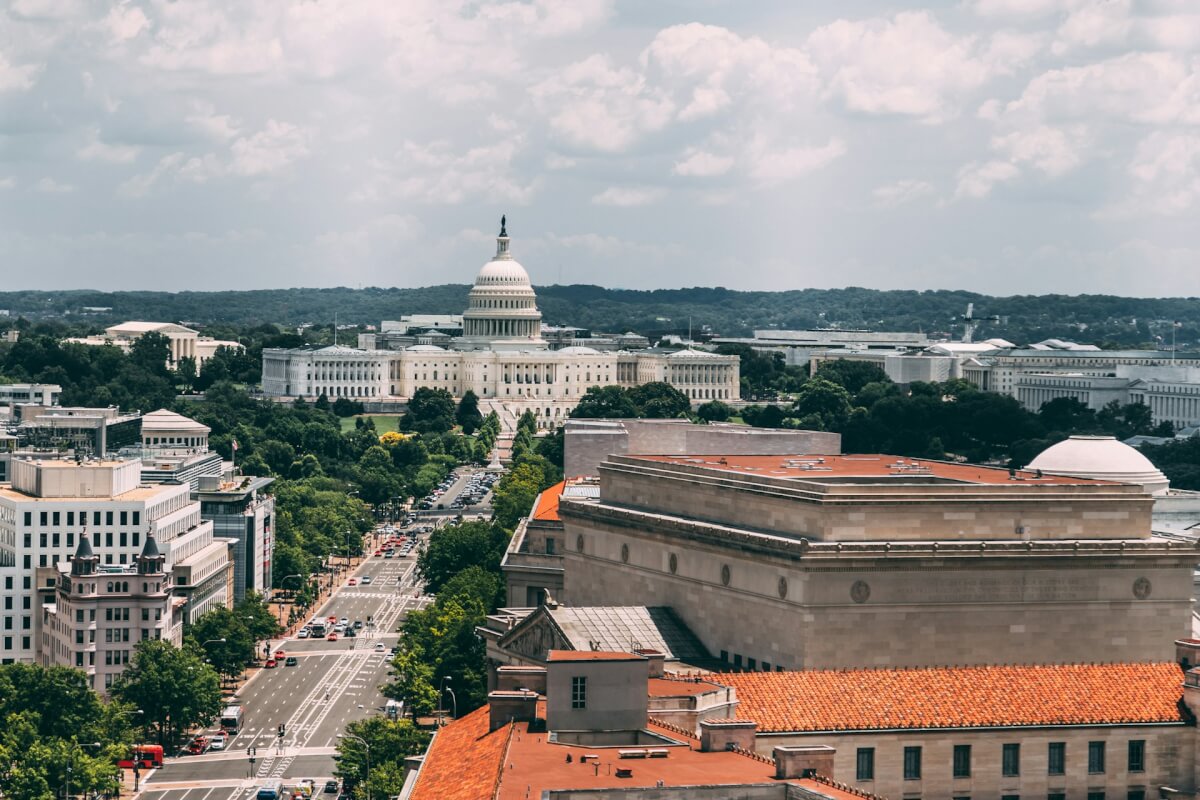
Washington, DC Tops List Of ‘America’s Hardest-Working Cities’


In a nation known for its strong work ethic, some cities stand out as shining examples of the American spirit. After all, work is the backbone of the American dream. A recent study by WalletHub set out to identify the hardest-working cities in the United States, comparing 116 of the most populated cities across 11 key metrics. Who came out on top? Results point to our nation’s capital, Washington, DC!
The study offers a fascinating insight into the work habits of Americans and the factors that contribute to a city’s overall work ethic. Conducted in February 2024, researchers looked at two main dimensions: “Direct Work Factors” and “Indirect Work Factors.” Direct Work Factors, which accounted for 80% of the total score, included metrics such as average workweek hours, employment rate, and the share of households where no adults work. Indirect Work Factors, which made up the remaining 20%, considered aspects like average commute time, the share of workers with multiple jobs, and annual volunteer hours per resident.
With that said, let’s take a look at the full list!
| Overall Rank* | City | Total Score | Direct Work Factors Rank | Indirect Work Factors Rank |
|---|---|---|---|---|
| 1 | Washington, DC | 76.97 | 4 | 9 |
| 2 | Irving, TX | 76.39 | 1 | 46 |
| 3 | Cheyenne, WY | 76.15 | 7 | 27 |
| 4 | Virginia Beach, VA | 75.79 | 8 | 11 |
| 5 | Anchorage, AK | 75.55 | 3 | 85 |
| 6 | Norfolk, VA | 75.27 | 9 | 14 |
| 7 | Dallas, TX | 75.21 | 5 | 32 |
| 8 | San Francisco, CA | 74.67 | 6 | 40 |
| 9 | Denver, CO | 73.93 | 12 | 22 |
| 10 | Austin, TX | 73.82 | 2 | 79 |
| 11 | Sioux Falls, SD | 73.56 | 11 | 74 |
| 12 | Corpus Christi, TX | 73.44 | 10 | 76 |
| 13 | Plano, TX | 72.84 | 14 | 38 |
| 14 | Fort Worth, TX | 72.14 | 16 | 30 |
| 15 | Arlington, TX | 72.12 | 15 | 31 |
| 16 | Chesapeake, VA | 71.85 | 30 | 7 |
| 17 | Aurora, CO | 71.68 | 24 | 16 |
| 18 | Laredo, TX | 70.98 | 23 | 62 |
| 19 | Garland, TX | 70.90 | 25 | 21 |
| 20 | Nashville, TN | 70.52 | 13 | 77 |
| 21 | Manchester, NH | 70.24 | 34 | 35 |
| 22 | Omaha, NE | 70.00 | 36 | 25 |
| 23 | Raleigh, NC | 69.92 | 29 | 29 |
| 24 | Charlotte, NC | 69.89 | 33 | 24 |
| 25 | Chandler, AZ | 69.74 | 20 | 64 |
| 26 | Scottsdale, AZ | 69.70 | 17 | 78 |
| 27 | Houston, TX | 69.24 | 26 | 51 |
| 28 | Gilbert, AZ | 68.75 | 31 | 50 |
| 29 | Tampa, FL | 68.55 | 19 | 97 |
| 30 | Boston, MA | 68.45 | 49 | 3 |
| 31 | Fremont, CA | 68.22 | 37 | 33 |
| 32 | Seattle, WA | 68.05 | 51 | 6 |
| 33 | Atlanta, GA | 67.86 | 32 | 69 |
| 34 | Portland, ME | 67.72 | 40 | 57 |
| 35 | Colorado Springs, CO | 67.43 | 52 | 17 |
| 36 | Oklahoma City, OK | 66.95 | 22 | 101 |
| 37 | Indianapolis, IN | 66.91 | 47 | 18 |
| 38 | St. Petersburg, FL | 66.78 | 28 | 100 |
| 39 | Orlando, FL | 66.71 | 21 | 107 |
| 40 | Jacksonville, FL | 66.42 | 18 | 109 |
| 41 | Lubbock, TX | 66.40 | 39 | 98 |
| 42 | Baltimore, MD | 66.38 | 71 | 2 |
| 43 | San Antonio, TX | 66.14 | 35 | 86 |
| 44 | Salt Lake City, UT | 66.02 | 66 | 5 |
| 45 | Phoenix, AZ | 65.90 | 41 | 54 |
| 46 | Durham, NC | 65.80 | 43 | 88 |
| 47 | Fargo, ND | 65.52 | 48 | 63 |
| 48 | Little Rock, AR | 65.32 | 38 | 115 |
| 49 | Kansas City, MO | 65.25 | 50 | 41 |
| 50 | San Jose, CA | 65.19 | 42 | 55 |
| 51 | Miami, FL | 64.91 | 27 | 114 |
| 52 | Oakland, CA | 64.67 | 53 | 42 |
| 53 | Boise, ID | 64.18 | 63 | 48 |
| 54 | Portland, OR | 64.17 | 83 | 1 |
| 55 | El Paso, TX | 64.13 | 64 | 43 |
| 56 | Jersey City, NJ | 63.89 | 58 | 37 |
| 57 | Louisville, KY | 63.82 | 57 | 34 |
| 58 | Honolulu, HI | 63.72 | 46 | 110 |
| 59 | Tulsa, OK | 63.57 | 45 | 111 |
| 60 | Billings, MT | 63.48 | 62 | 66 |
| 61 | Minneapolis, MN | 62.77 | 77 | 13 |
| 62 | Des Moines, IA | 62.75 | 69 | 67 |
| 63 | Lexington-Fayette, KY | 62.52 | 54 | 102 |
| 64 | Wichita, KS | 62.36 | 56 | 105 |
| 65 | Glendale, AZ | 62.34 | 70 | 47 |
| 66 | Jackson, MS | 62.11 | 60 | 106 |
| 67 | San Diego, CA | 61.95 | 59 | 80 |
| 68 | Columbus, OH | 61.94 | 65 | 59 |
| 69 | Irvine, CA | 61.62 | 55 | 89 |
| 70 | Fort Wayne, IN | 61.56 | 68 | 93 |
| 71 | Hialeah, FL | 61.44 | 44 | 112 |
| 72 | Santa Ana, CA | 61.29 | 61 | 87 |
| 73 | Lincoln, NE | 61.25 | 82 | 28 |
| 74 | Mesa, AZ | 61.13 | 72 | 61 |
| 75 | Long Beach, CA | 60.69 | 74 | 65 |
| 76 | St. Louis, MO | 60.65 | 81 | 36 |
| 77 | St. Paul, MN | 60.56 | 85 | 12 |
| 78 | Anaheim, CA | 60.49 | 73 | 75 |
| 79 | Reno, NV | 60.45 | 75 | 90 |
| 80 | Los Angeles, CA | 60.14 | 76 | 60 |
| 81 | Chula Vista, CA | 60.11 | 78 | 53 |
| 82 | Winston-Salem, NC | 59.59 | 79 | 92 |
| 83 | Henderson, NV | 59.19 | 80 | 71 |
| 84 | Philadelphia, PA | 58.52 | 98 | 8 |
| 85 | Birmingham, AL | 58.29 | 67 | 108 |
| 86 | North Las Vegas, NV | 58.14 | 84 | 49 |
| 87 | Chicago, IL | 57.71 | 89 | 39 |
| 88 | Las Vegas, NV | 57.28 | 88 | 58 |
| 89 | Cincinnati, OH | 57.23 | 97 | 20 |
| 90 | Bakersfield, CA | 56.29 | 93 | 72 |
| 91 | Albuquerque, NM | 56.16 | 92 | 84 |
| 92 | Memphis, TN | 55.91 | 91 | 73 |
| 93 | Riverside, CA | 55.36 | 94 | 68 |
| 94 | New Orleans, LA | 55.26 | 87 | 96 |
| 95 | Greensboro, NC | 55.08 | 96 | 94 |
| 96 | Sacramento, CA | 54.96 | 90 | 95 |
| 97 | Wilmington, DE | 54.60 | 95 | 81 |
| 98 | Pittsburgh, PA | 54.41 | 104 | 19 |
| 99 | New York, NY | 53.70 | 101 | 44 |
| 100 | Baton Rouge, LA | 53.43 | 100 | 91 |
| 101 | Madison, WI | 52.98 | 99 | 104 |
| 102 | Milwaukee, WI | 52.85 | 108 | 10 |
| 103 | Charleston, WV | 52.61 | 86 | 116 |
| 104 | Stockton, CA | 52.28 | 106 | 15 |
| 105 | Tucson, AZ | 51.94 | 102 | 99 |
| 106 | Providence, RI | 51.60 | 107 | 26 |
| 107 | San Bernardino, CA | 50.62 | 105 | 83 |
| 108 | Columbia, SC | 50.33 | 103 | 113 |
| 109 | Cleveland, OH | 50.00 | 110 | 23 |
| 110 | Fresno, CA | 48.86 | 109 | 82 |
| 111 | Bridgeport, CT | 48.31 | 112 | 4 |
| 112 | Toledo, OH | 47.50 | 111 | 52 |
| 113 | Newark, NJ | 43.19 | 113 | 45 |
| 114 | Buffalo, NY | 39.22 | 114 | 103 |
| 115 | Detroit, MI | 39.08 | 115 | 70 |
| 116 | Burlington, VT | 34.43 | 116 | 56 |
So why did Washington, D.C. emerge as the hardest-working city? This is due, in part, to the city having the highest share of workers who leave vacation time unused at 64%. Residents of D.C. also work the third-most hours per week on average and are willing to take relatively long commutes to work, adding over 30 minutes to their workday. Additionally, more than 30% of the District’s residents are members of local volunteer groups or organizations, showcasing their dedication to their community.
Irving, TX, secured the second spot on the list, largely because it has the lowest share of households where no adults work, at only 11%. Irving also ranks ninth in the country for the mean number of hours worked per week. However, this hard work comes at a cost, with Irving residents having significantly less leisure time compared to people in most other cities.
Cheyenne, WY, rounded out the top three, with residents putting in the third-most hours per week, on average. The city boasts one of the highest employment rates in the country, at over 97%, meaning nearly all working-age residents are employed. Cheyenne also has the seventh-highest rate of workers with multiple jobs, at nearly 7%. As a result, people in Cheyenne have the third-lowest amount of leisure time, on average.
The WalletHub study employed a comprehensive methodology to determine the hardest-working cities in America. The research team evaluated 116 of the most populated cities using two key dimensions: “Direct Work Factors” and “Indirect Work Factors.” These dimensions were assessed using 11 key metrics, each graded on a 100-point scale, with a score of 100 representing the “hardest-working.”
The Direct Work Factors dimension, which accounted for 80% of the total score, included six metrics. The average workweek hours were given the highest weight (triple weight, ~36.92 points), as this metric directly measures the time spent working. The employment rate and the share of households where no adults work were both given full weight (~12.31 points each), as they provide insight into the overall employment situation in each city. The share of workers leaving vacation time unused and the share of engaged workers (a state-level metric) were assigned half weight (~6.15 points each), as they relate to work dedication and engagement. Finally, the idle youth (16-24) rate was also given half weight, as it indicates the proportion of young people not engaged in work or education.
The Indirect Work Factors dimension, which made up the remaining 20% of the total score, included five metrics, each given full weight (~4.00 points). The average commute time was included as it can significantly impact the total time spent on work-related activities. The share of workers with multiple jobs (a state-level metric) was considered as it reflects the need for some individuals to work more than one job. Annual volunteer hours per resident and the share of residents who participate in local groups or organizations were included to account for community engagement and additional time commitments outside of paid work. Lastly, the average leisure time spent per day (a state-level metric) was considered as it relates to work-life balance.
To calculate the overall score for each city, the researchers determined the weighted average across all 11 metrics. The resulting scores were then used to rank-order the cities from hardest-working to least hard-working. To ensure a geographically diverse sample, the study included at least one city from each of the 50 states. It is important to note that the term “city” in this study refers specifically to the city proper and does not include the surrounding metropolitan area.
By employing this multi-faceted approach, the WalletHub study aimed to provide a comprehensive assessment of the work ethic in American cities. The methodology takes into account both direct measures of work, such as hours worked and employment rates, as well as indirect factors that can impact work-life balance and overall quality of life. This detailed analysis allows for a nuanced understanding of the factors contributing to a city’s overall work ethic and provides valuable insights for policymakers, employers, and residents alike.